Monitoring crop health across the Netherlands
The Copernicus Sentinel satellite missions measure and image our planet in different ways to return a wealth of complementary information so that we can understand and track how our world is changing, and how to better manage our environment and resources. Thanks to the benefits of different types of data from two particular Copernicus Sentinel missions and an ingenious new dataset tool, people working in the agriculture sector, but who are not satellite data experts, can monitor the health and development of crops, right down to each crop in individual fields.
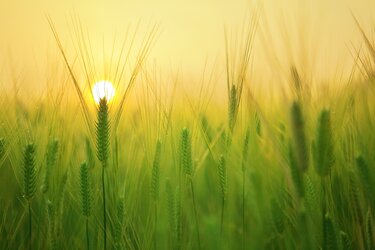
It goes without saying that we all depend on agriculture for food. However, the growing global population and the climate crisis is putting untold pressure on food production and water resources. While rich developed nations may be able to weather a failed crop, the loss of a precious harvest can be disastrous for many countries facing the serious issue of food security.
Taking measurements from hundreds of kilometres above, satellites are key to monitoring crop health, forecasting yields, assessing vulnerability to drought and even to estimating carbon uptake by the soil so that agricultural carbon footprints can be reduced.
And, the benefits are even greater if completely different types of satellite data can be used in synergy.

However, very few of us are satellite data experts, so it is critical that datasets are made available in easy to understand and easy to use ways.
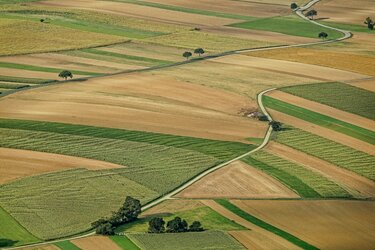
Addressing this need, ESA worked with the Delft University of Technology in the Netherlands to develop the Agricultural Sandbox NL. As its name suggests, this toolset has been used to hone in on the Netherlands where much land is given over to agriculture.
The first milestone in the project, marked the team succeeding in creating nationwide maps, over an entire year, of land showing crop type, indicators of crop health and growth at parcel level, which is a continuous area of land declared by one farmer and includes no more than one crop type.
Remarkably, the toolset manages to reduce terabytes of satellite data to just 10 gigabytes per year.

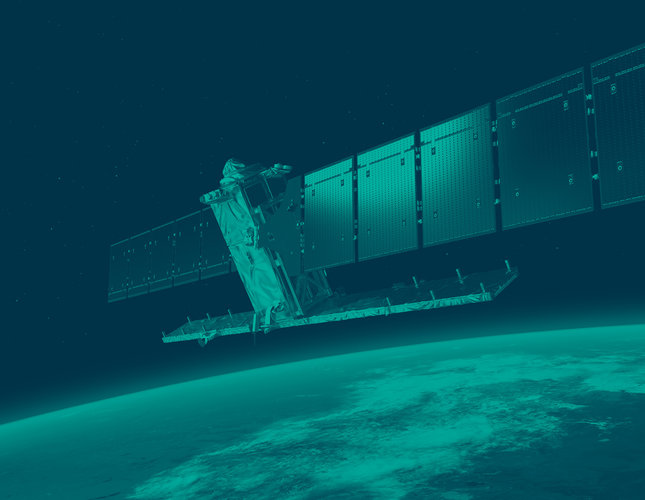
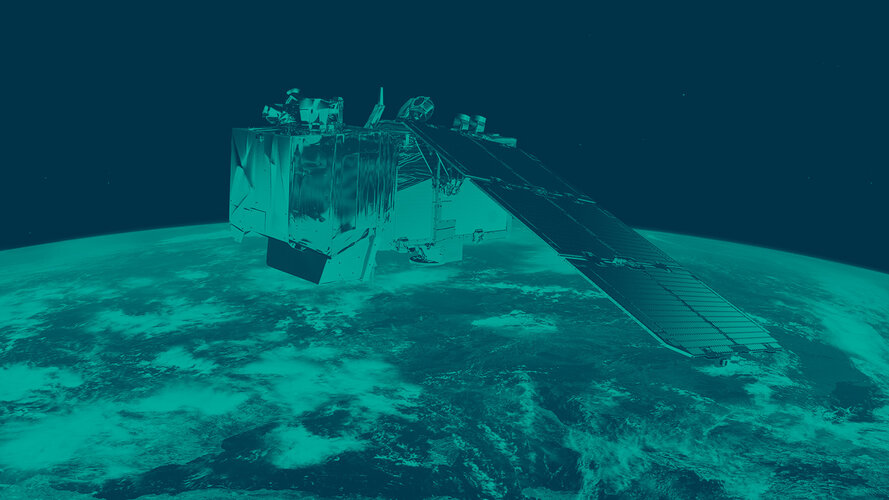
Agricultural Sandbox NL makes use of radar data from Copernicus Sentinel-1 and optical, or camera-like, data from Copernicus Sentinel-2.
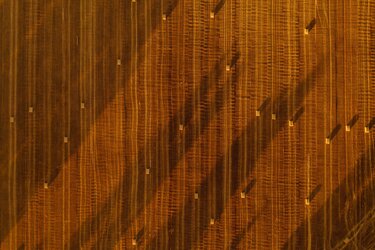
ESA’s Björn Rommen explains, “Both missions give us frequent coverage, which is critical to monitoring crop health in the growing season, and both missions give us detailed information in different ways. Sentinel-2 tells us about the greenness of the plants by measuring how much light they reflect and their colour. These images are the closest to what we see with our own eyes. But the radar on Sentinel-1 can unveil information about the plant’s structure and how much water is in the plant.
“And of course, Sentinel-1’s radar that images regardless of clouds and rain, which is pretty important in the Netherlands.
“Exploiting both types of measurement together gives us a really good indication of crop health, but the Agricultural Sandbox NL is the key thing that makes these data perfect for non-expert data users.”
The team produced maps, which are freely available to the public, for every agricultural parcel in the Netherlands from 2017 to 2020.
This experimental period shows that the toolset has real promise. Thanks to parcel and crop information, the toolset is already being used to train neural networks, allowing knowledge to be carried to other regions where such information is not readily available.

Delft University of Technology’s Susan Steele-Dunne adds, “One of the nice things about working in the Netherlands is that there are freely available data on parcel boundaries and crop types. By combining those with the Sentinel data, we created a database where new users can see how data from Sentinel-1 and Sentinel-2 look for different crops.
“They can search the data by area, crop type and time period to see the effects of drought, flooding and storm damage, for example. And the data are already processed, so they are much easier to work with. We hope that by making the data more accessible to new users, we can stimulate new applications of Sentinel data in agriculture.”