Applications
Evapotranspiration reductions
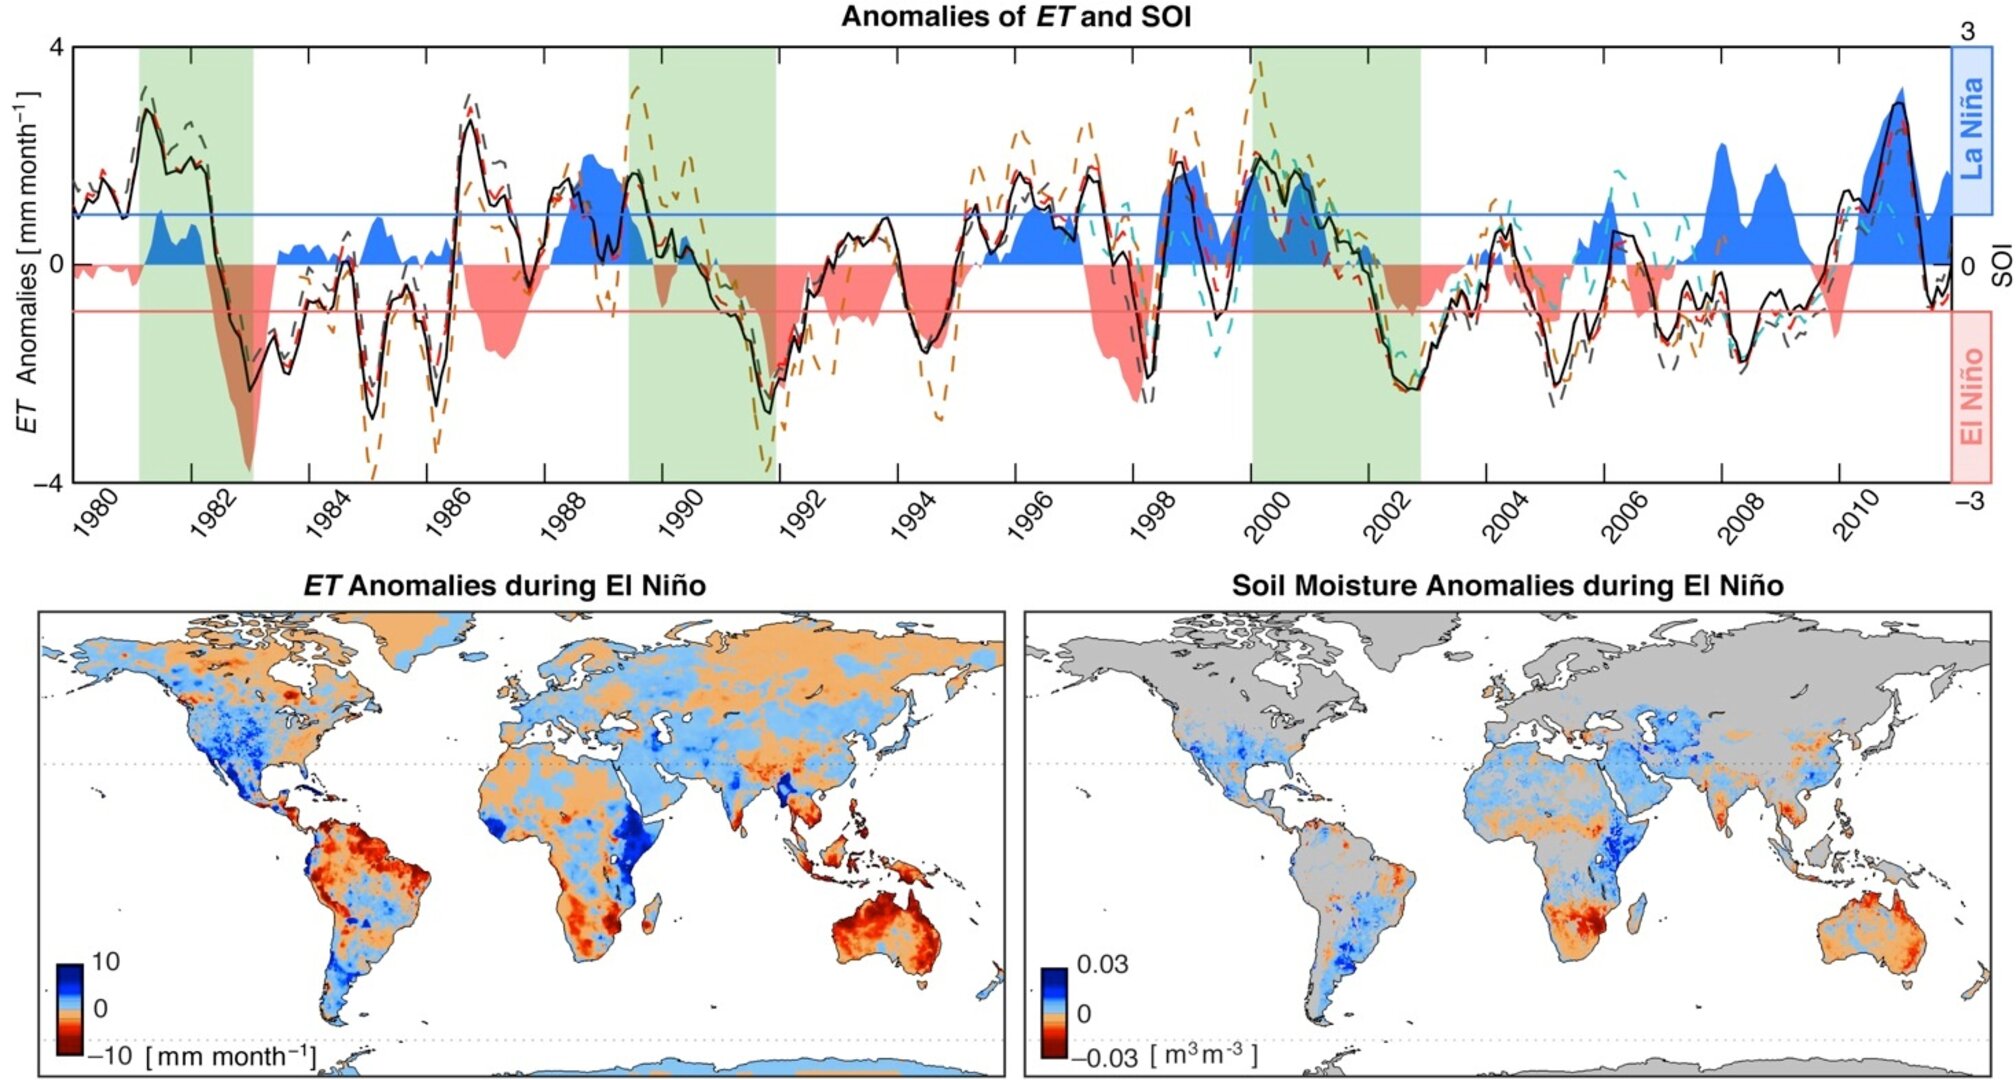
Top: monthly anomalies from five different evapotranspiration (ET) estimates and the Southern Oscillation Index (SOI) for 1980–2011. Bottom: during El Niño months (with low SOI, marked by red line on top), the average monthly anomalies of ET (left) and of the independent ESA-CCI soil moisture (right).