Interactive map of the sky from Gaia’s Early Data Release 3
Explore our Milky Way in this map of the entire sky. It shows the total brightness and colour of 1.8 billion stars observed by ESA’s Gaia satellite and released as part of Gaia’s Early Data Release 3 (Gaia EDR3).
Brighter regions represent denser concentrations of bright stars, while darker regions correspond to patches of the sky where fewer and fainter stars are observed. The colour of the image is obtained by combining the total amount of light with the amount of blue and red light recorded by Gaia in each patch of the sky.
The bright horizontal structure that dominates the image is the plane of our Milky Way galaxy. It is actually a flattened disc seen edge-on that contains most of the galaxy’s stars. In the middle of the image, the Galactic centre appears bright, and thronged with stars.
Darker regions across the Galactic plane correspond to foreground clouds of interstellar gas and dust, which absorb the light of more distant stars. Many of these clouds conceal stellar nurseries where new generations of stars are currently being born.
Zoom in on the dots across the image to discover many globular and open clusters, as well as entire galaxies beyond our own. The two bright objects in the lower right of the image are the Large and Small Magellanic Clouds, two dwarf galaxies orbiting the Milky Way.
Gaia's all-sky colour view is also available in equirectangular projection (suitable for full-dome presentations) here.
Gaia's all-sky colour view is also available in Hammer projection here.

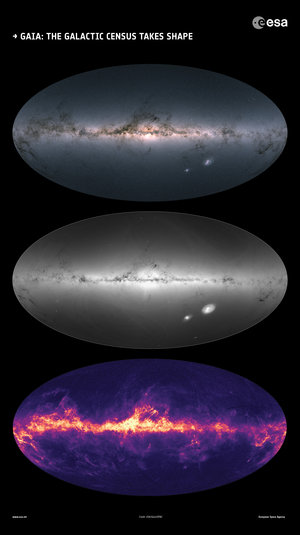
Gaia observes the Milky Way
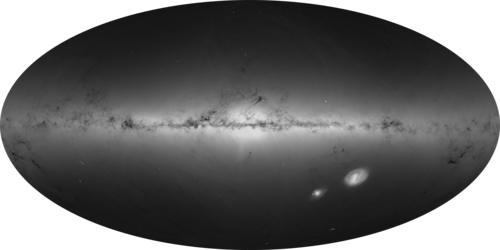
The density of stars from Gaia’s Early Data Release 3
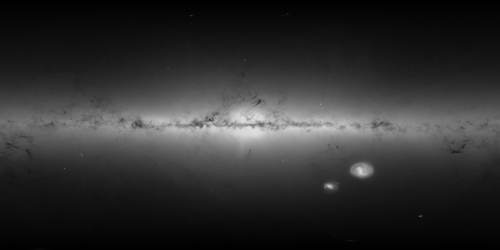
The density of stars from Gaia’s Early Data Release 3
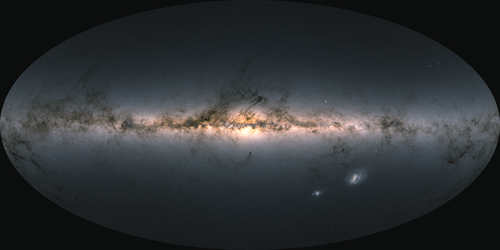
The colour of the sky from Gaia’s Early Data Release 3